Identifying Vulnerable Healthcare Facilities Due to the Effects of Precipitation
Project Overview
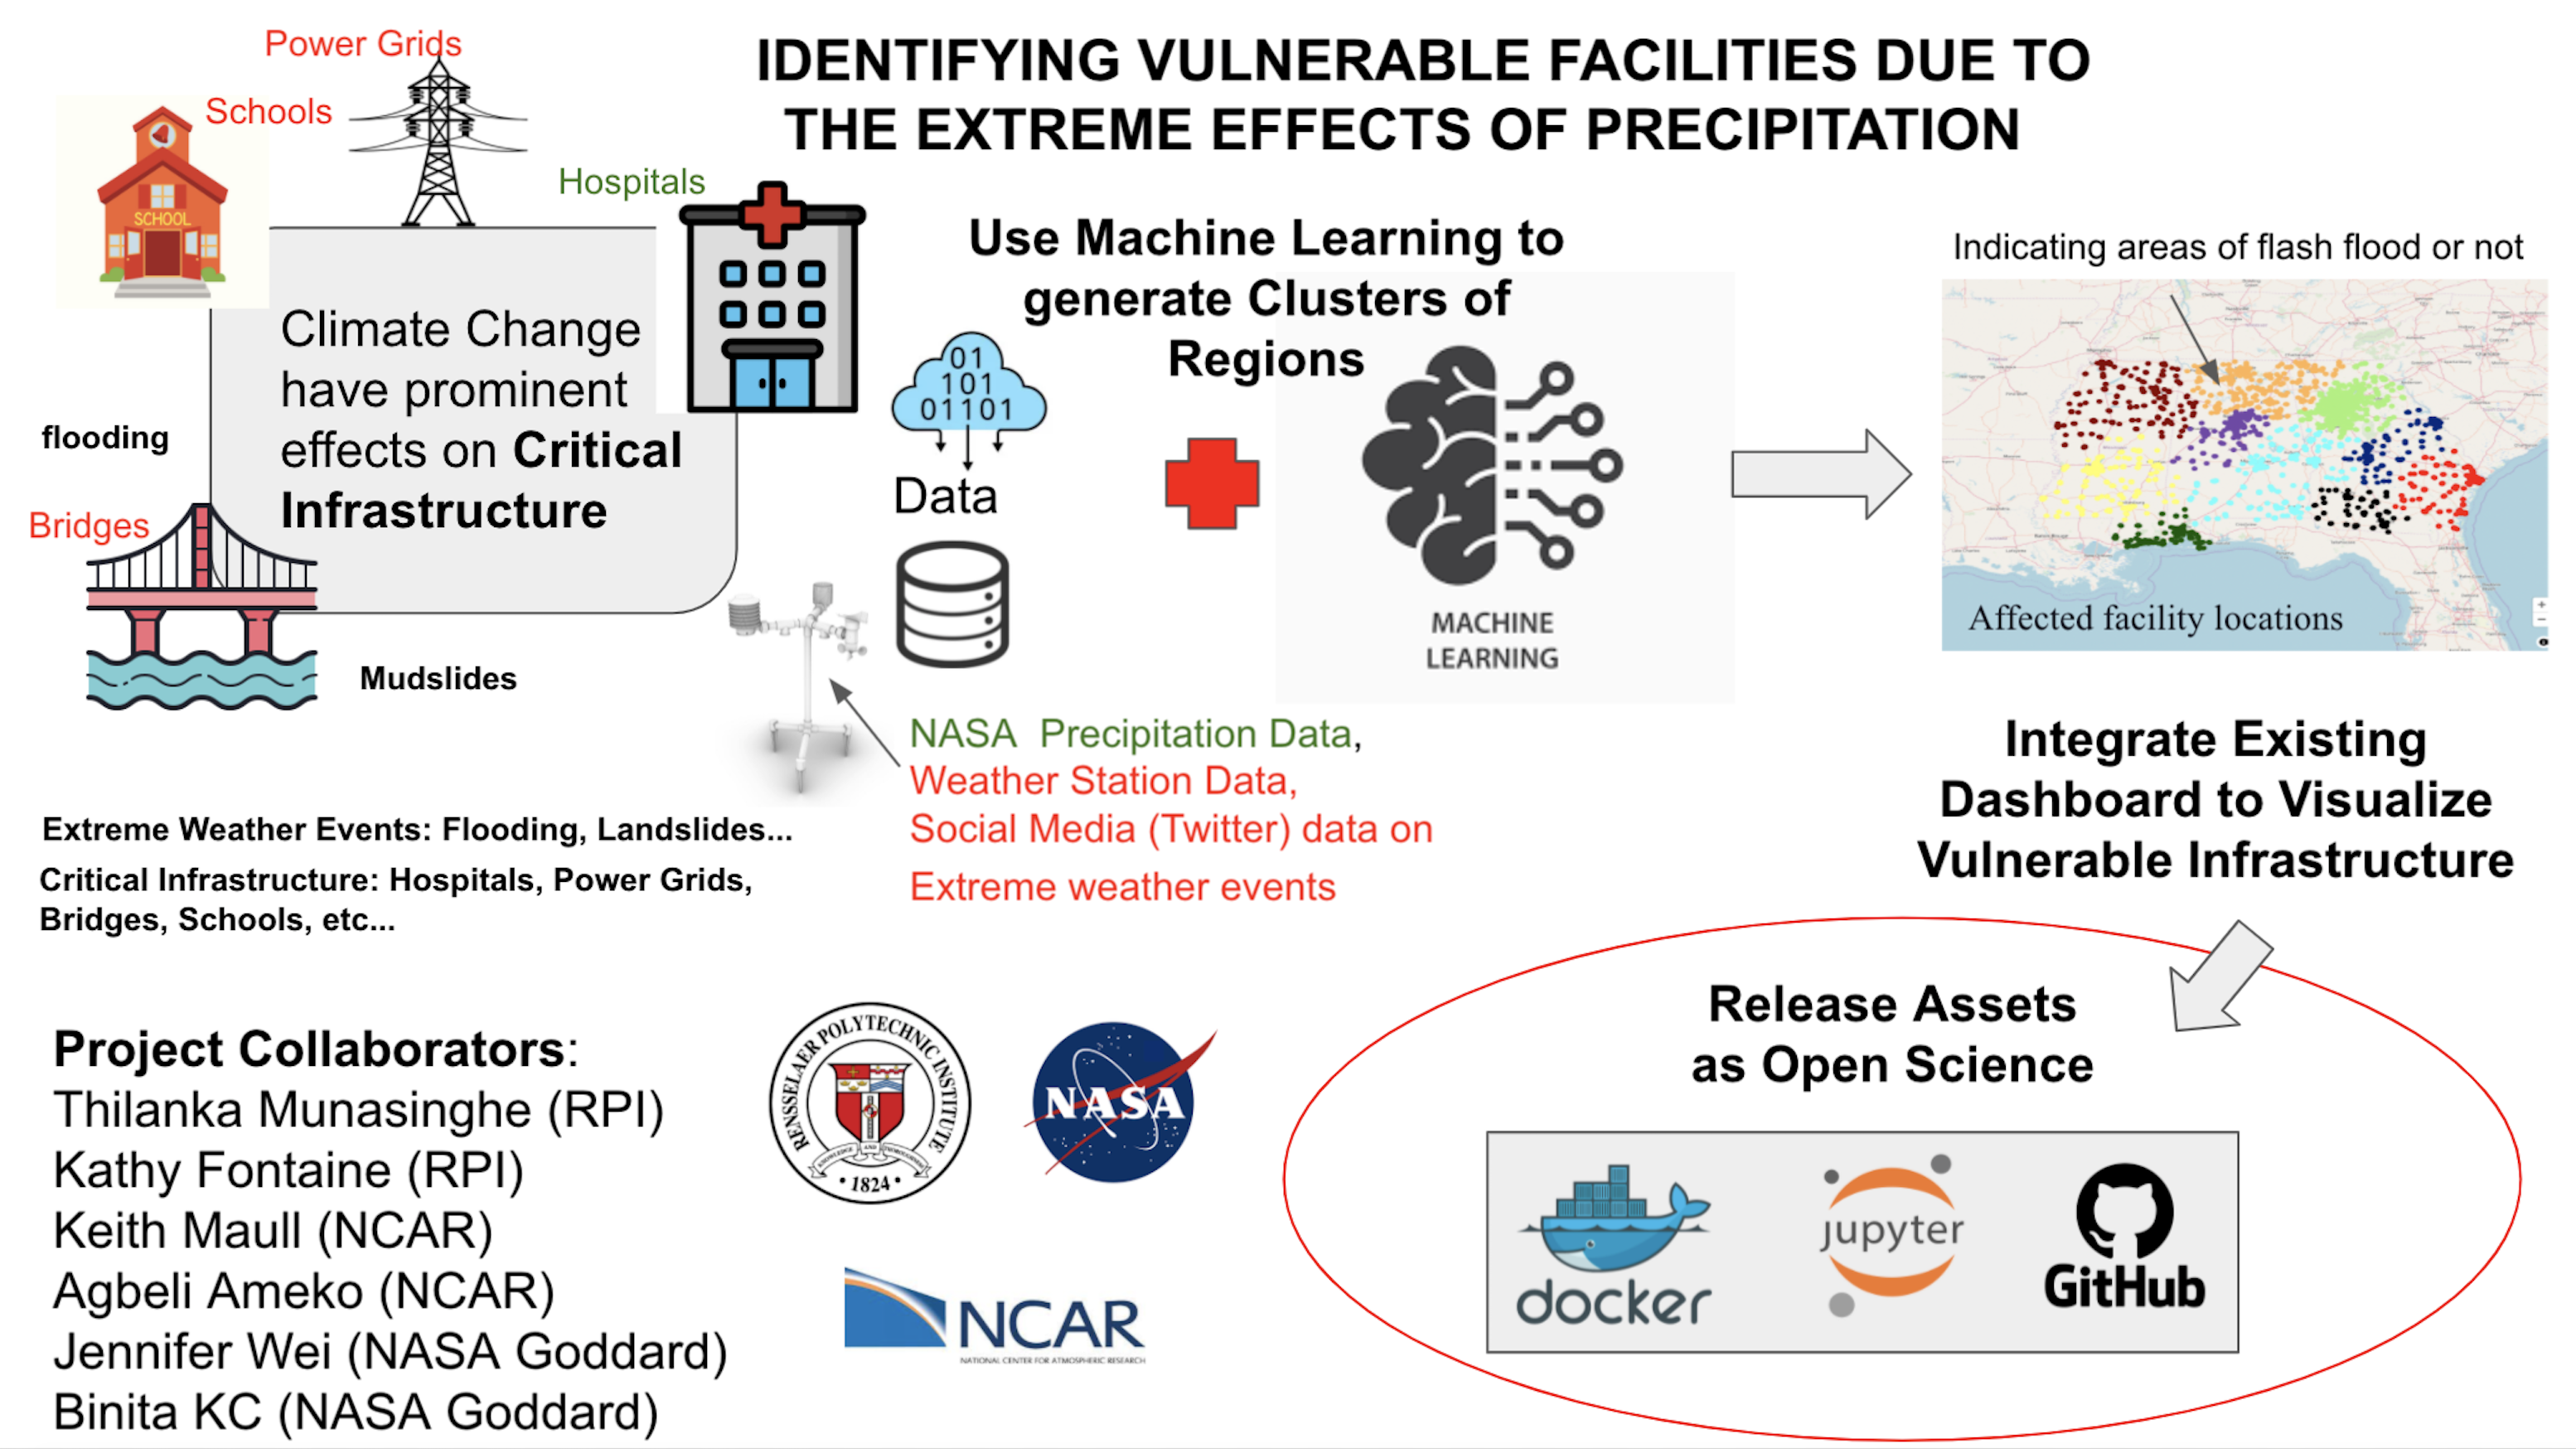
Healthcare facilities provide communities with access to health services. Unfortunately, natural hazards can severely damage or cause temporary shutdowns of these facilities, disrupting the normal flow of day-to-day life. As witnessed by the recent snowstorm and the subsequent power outages in Texas in February of 2021, damages to these facilities resulted in the loss of human lives and a disruption in healthcare services. Flood, a natural hazard, affects healthcare facilities at large. The rainfall triggered flash floods in the state of Massachusetts inundated healthcare facilities. This led to dozens of patients being transported to another hospital because of the hospital’s inability to function. Infrastructure vulnerability poses a threat to many countries and regions of the world where extreme precipitation is a common factor. Changing climatic conditions such as increasing frequency and intensity of extreme precipitation results in increased flood risk, thereby increasing the vulnerability of healthcare facilities.
Historical precipitation records provide a good estimate of the potential areas of high risk, which then can be used to assist in combating these infrastructural losses. Here, we explore the areas of extreme precipitation using historical precipitation data to identify vulnerable healthcare facilities across several states in the US. By applying several Machine Learning (ML) clustering algorithms such as K-Means, DBSCAN (Density-Based Spatial Clustering of Applications with Noise), and Agglomerative clustering to identify areas of extreme vulnerability, the results showed high correlation between extreme precipitation and high risk. We used precipitation data from the NASA Global Precipitation Mission (GPM). Infrastructure data was obtained form Homeland Infrastructure Foundation-Level Data (HIFLD) for Hospital , Urgent Care Centers , Pharmacies , Dialysis Center Locations.
When focusing on the South-Eastern United States, as this region has historically seen extreme rainfall, we have found that different states experience different risks, impacted by precipitation received across months of a given year. This further implies that other environmental factors would also play an important role while determining the risk of a given healthcare facility (and the region overall) and would form the basis for our future work by incorporating the landslide occurrence data from Global Landslide Nowcasts from LHASA, a landslide nowcast model to better predict and rank high risk facilities.
We have implemented an easy-to-use interactive dashboard highlighting poentially vulnerable infrastructures focusing on the South-Eastern part of the United States. At the momement we are integrating the other regions of the United States to this dashboard, enabling local governments and administrations to identify potential areas of flooding and landslides.
Interactive Dashboard
Project Proposal Poster
Poster Presented at ESIP (Earth Sceince Information Partners 2021 Summer)
This poster was presented at the 2021 Earth Science Information Partners (ESIP) Summer Meeting held virtually in July 2021. This poster is available in the ESIP archives.
American Geophysical Union (AGU) 2021 Fall Meeting Abstract Submission
We have submitted the current progress of this research project work to AGU 2021 Fall Meeting Abstract Submission

